Tuesday, April 14, 2009
Our icy seas
Notwithstanding hysterical media claims that arctic sea is "melting like ice cubes in soda," global sea ice are is once again decisively above the 1979-1990 "baseline" level established early in the satellite era (click on the image below to get better resolution).
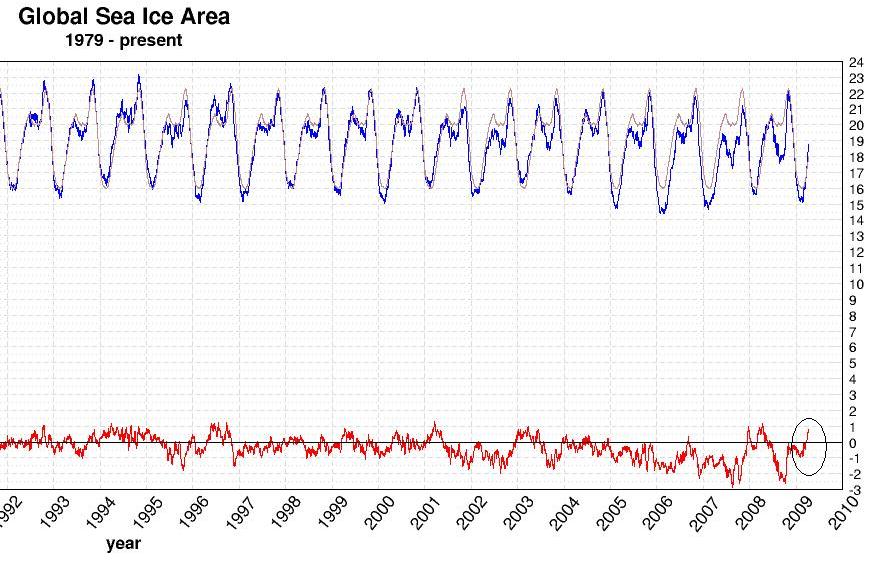
The above-baseline reading is due to high levels of southern hemisphere sea ice, which more than make up for the decline in the Arctic. That said, even Arctic sea ice is not far below the baseline (click on the image to make it readable, and then scroll horizontally to the right), at least if measured by area.
7 Comments:
By  Brian Schmidt, at
Tue Apr 14, 06:03:00 PM:
Brian Schmidt, at
Tue Apr 14, 06:03:00 PM:
Once again, AGW predicts rapid decline of Arctic sea ice but mixed effects on Antarctic ice. So the data supports rather than contradicts AGW theory and models. There is some evidence that large Arctic ice declines show the models are too optimistic about the future, but that's unsettled.
And by the way, I'd say a half-million square kilometers below the mean for Arctic ice is nothing to sneeze at.
By , at
Tue Apr 14, 07:52:00 PM:
TH was posting on sea ice levels. Lets try to stay on topic, shall we?
By , at
Tue Apr 14, 11:03:00 PM:
Brian,
I note that you are citing AGW "theory and models". How accurate are these models? How do we know? I'm sure you will agree that the climate of the planet is more than a little complicated. I'm also sure that the people that put the AGW models together are some of the most intelligent people on the planet. Finally, I'm sure that the people that put the financial models together that told us that the CDOs, etc. that just blew up in our faces were just fine and dandy, are also some of the most intelligent people on the planet. One of those models has been proven to be fatally flawed.
Again, how do we know that the AGW model is not also flawed?
Note - I'm not even disputing that the global temperature is increasing (although there is evidence that it has not increased for the past 8 years), but I AM disputing that we somehow *know* it is increasing due to the activities of humans.
DC Hawk
By  TigerHawk, at
Wed Apr 15, 12:19:00 AM:
TigerHawk, at
Wed Apr 15, 12:19:00 AM:
My point was not to attack AGW models, but the press coverage around Arctic sea ice, much of which is driven by activists who want to say that the melting of Arctic sea ice is in and of itself a problem.
I do wonder, however, how many of the AGW models that "predict" these effects on sea ice actually were developed and made these predictions before the trends of recent years manifested themselves. Brian, are there any articles based on models from before, say, 1990, that predict these trends? That would be interesting.
By Mike, at
Wed Apr 15, 06:11:00 AM:
Brian -
Like TH, I'm skeptical of global warming, but open-minded. The global warming evidence I've seen has appeared shoddy, but maybe I'm looking in the wrong place.
A prediction of ice increase in the South and decrease in the North would be the first (weakly) confirmed evidence for these models I've noticed.
1a) Is there a global warming consensus model at a given point in time?
1b) At what point did it begin predicting ice declines in the Arctic and increases in the Antarctic?
2a) If there's no consensus model, is there at least a list of "respectable" models, compiled before results came in?
2b) How many of these models made the prediction?
Thanks,
Mike
By Brian Schmidt, at
Wed Apr 15, 01:11:00 PM:
TH - the IPCC reports rely on science done no later than 1 - 2 years earlier than when the report's published, so the 1991 IPCC report (the first one) comes pretty close to what you're asking for. It's online - I haven't read what it says about the Arctic but I'll bet it says magnified warming.
Mike - I'd say all the warming since 1991 also validates the models.
By Mike, at
Thu Apr 16, 08:24:00 AM:
Brian -
1) Can you link to the 1991 Arctic / Antarctic predictions?
2) I tried looking for post-1991 warming in online data (more for my own lay curiosity - I'm not sure you'll even return to this post):
a) ground measurements from surface weather stations - these have apparently been contaminated by heat island effects and cruder problems (nearby AC exhaust, heating pipes, barbecues, etc.). See http://www.surfacestations.org/ There are far too many correction factors to avoid biasing data in favor of desired trend. I ignored it and moved on.
b) Satellite data - http://www.remss.com/msu/msu_browse.html shows temperatures sampled from space. There are a number of correction factors (diurnal drift, microwave absorption at different altitudes, etc.), but I'm presuming the work has been performed well. Temps are sampled at four different altitudes.
i) Lowest altitude (about 3 miles up). The data set is inexplicably biased (averages 70°S to 82.5°N) - even though the data at all elevations show the North warming and South cooling. Ignored it and moved on.
ii) 2nd lowest altitude (about 4 miles up). Looked at 82.5°S to 82.5°N 1/91-3/09 (last measurement) - shows a decline of .003K (almost imperceptible).
iii) 3rd lowest altitude (about 7 miles). Slightly stronger cooling
iv) highest altitude (10 miles) - strong cooling (but this could be sunspot cycle, etc).
Are you sure we're seeing any evidence of good predictive models?
Mike
![]()