Wednesday, November 05, 2008
The return of sea ice
Scientists have been tracking the extent of global sea ice -- Arctic and Antarctic -- by satellite since the 1970s. This website has all sorts of data on the subject, including a long-term graph that compares total global sea ice against a "baseline" reading. The idea is to show an "anomaly" against that baseline that would be evidence of some change, including possibly anthropogenic global warming. Indeed, the extent of sea ice is considered by some climate scientists to be part of a feedback loop -- ice reflects sunlight more than water, so if the ice area shrinks the planet will absorb more heat leading to... even more ice melting. In this way of thinking, melting sea ice is both a tangible manifestation of global warming and a cause of further warming. The mainstream media has been almost hysterical on the subject. Sea ice news is, well, hot.
Imagine my surprise to learn this evening that the global sea ice anomaly (which was in any case in positive territory as recently as earlier this year before falling during the Northern Hemisphere summer) has once again disappeared. At least for now. Here is a closeup:
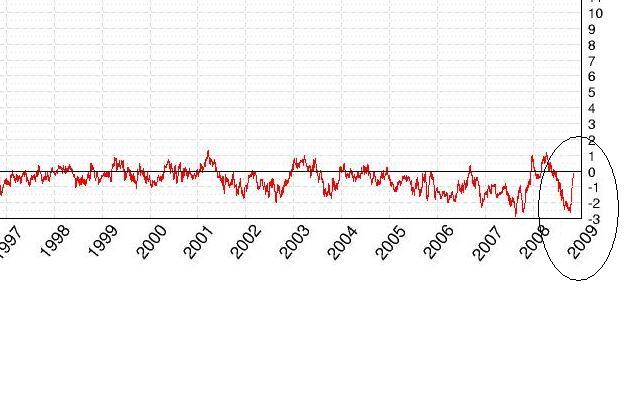
That's right. Satellites show that the area of the planet covered by sea ice is back to the baseline.
We await the breathless headlines with, well, bated breath.
15 Comments:
By  JPMcT, at
Thu Nov 06, 12:42:00 AM:
JPMcT, at
Thu Nov 06, 12:42:00 AM:
I would enjoy a robust, protracted discussion of the effect on the sea ice of total atmospheric volume of beer-induced mammal flatus.
I intend to apply for a grant to study this possible earth altering effect on a target population somewhere close to sea level...any beachfront will do...perhaps St. Thomas or St. Kitt's.
By  , at
Thu Nov 06, 12:45:00 AM:
, at
Thu Nov 06, 12:45:00 AM:
The obvious flaw here treating some measurements taken in the 1970s as the "baseline". What makes that period of time so special we should assume that things as they were then are the way things should be forever?
By Brian, at
Thu Nov 06, 02:21:00 AM:
This would be valid if a single cold day in the summer disproves global warming. It doesn't.
Also worth noting, once again, that Antarctic isn't experiencing the same level of warming as the Arctic, so you would see a global warming signal in the Northern Hemisphere late summer. Which you do.
By , at
Thu Nov 06, 03:33:00 AM:
This would be valid if a single cold day in the summer disproves global warming. It doesn't.
I beg to differ. Global warming doesn't require disproof. It is an extraordinary claim, requiring extraordinary evidence that has not yet been produced. Climate has centuries long cycles (see Maunder Minimum, Medieval Warm Period), so using a few years in the decade of the 1970s as a baseline for what the arctic ice "should" be is exactly like using a single cold day in the summer to prove the rest of the summer is unseasonably hot.
By TigerHawk, at
Thu Nov 06, 06:46:00 AM:
A few items.
Obviously, sea ice or lack thereof neither "proves" nor "disproves" the AGW hypothesis. My point here is to mock the press, which activists (such as Nobel Laureate Al Gore) goad into hyping warming "factoids" into panicky stories. See any number of speeches that Gore has given citing both intense hurricanes (this year at a 30-year low) and melting sea ice as AGW evidence.
Second, the AGW activists make two points about sea ice. The first is that it is melting, which is a sign of warming. Then you point out that there has been more sea ice in the Southern Hemisphere, and the response is (i) the melting in the north is further from the "baseline" than it is in the south, so it constitutes an anomaly, and (ii) a secondary problem with the melting ice is that it reduces albedo (reflectivity). The problem with the albedo argument is that the people who make it use only the northern anomaly, without ever explaining why the correct metric should not be the global anomaly (or lack thereof). After all, the sun lands on the whole planet.
I've seen several science journalists make the albedo argument. In every case, I have asked them to explain why Northern Hemisphere sea ice determines albedo, rather than global sea ice. They all promised to ask their sources and get back to me, and none of them ever have. Obviously, these people are under no obligation to respond to a blogger, but until one of them explains this point I am increasingly of the view that the people who push the albedo point are being intellectually dishonest.
By , at
Thu Nov 06, 09:36:00 AM:
TH:
Re your point i., the climate models predicted more warming in the Arctic than Antarctic, so the data reflects a validation of the models.
Your point ii. is basically correct, but to the extent the ice level is below the baseline more often than it is above baseline, the feedback is in effect.
One more thing: the baseline shown here is an annual average, which you are comparing to a current seasonal level. That's apples and oranges, so it's wrong to say without further analysis that we've returned to baseline.
By , at
Thu Nov 06, 09:44:00 AM:
Re your point i., the climate models predicted more warming in the Arctic than Antarctic, so the data reflects a validation of the models.
That would be great, if the climate models were generated by theory independent of the data. They weren't, they were curve-fitted. The data drove the model, which means the model validates nothing.
By , at
Thu Nov 06, 09:55:00 AM:
Lord have mercy!! The One hasn't even taken office and he is already curing the planet!!
By , at
Thu Nov 06, 10:00:00 AM:
It's called mean reversion http://en.wikipedia.org/wiki/Mean_reversion
By , at
Thu Nov 06, 11:18:00 AM:
Randian - all the models precede some of the data, and some of the models precede a lot of the data, so that after-the-fact data can't drive the models.
By , at
Thu Nov 06, 01:02:00 PM:
One more thing: the baseline shown here is an annual average, which you are comparing to a current seasonal level.
No. The anomaly is computed with reference to the average ice area for the particular date; i.e., if today's anomaly is zero, the ice area today equals the average area measured on Nov. 6 in past years.
Note that the terms extent and area are not interchangeable. If you have a region of a million square kilometers that's 80% ice and 20% open leads, it counts as a million square kilometers of ice extent but only 800,000 square kilometers of ice area.
By TigerHawk, at
Thu Nov 06, 01:05:00 PM:
One more thing: the baseline shown here is an annual average, which you are comparing to a current seasonal level. That's apples and oranges, so it's wrong to say without further analysis that we've returned to baseline.
Actually, Brian, if you click through to the unedited graph (last link before the graph on the post) you will see a seasonal wave that shows that sea ice is also at the seasonally-adjusted mean.
By , at
Thu Nov 06, 01:33:00 PM:
Paul, TH - I think you're right, although the graph could be a little more descriptive. So my "one more thing" comment would be wrong then.
By davod, at
Thu Nov 06, 04:39:00 PM:
Eu Referendum provides an update on early snow around the world.
I did warn you!
"...But even our wildest expectations are beginning to be outdone as we see a report from Reno of an early-season storm dropped up to 15 inches of snow in the Sierra, bogging down traffic on mountain highways but hastening the state of the ski season.
The Boreal resort atop Donner Summit reported 12 to 15 inches of snow from the storm, and said it plans Thursday to become the first Tahoe resort to open for the season. Alpine Meadows resort just north of Lake Tahoe on Tuesday reported 10 to 14 inches of new snow, and said it hopes to open slopes on 26 November..."
By , at
Fri Nov 07, 11:15:00 AM:
"has once again disappeared."
Just like it did a few dozen times in the past decade as shown in the graph? including just prior to falling to a record low and a 2nd record low?
More relevant is the Perennial sea ice time series http://www.arctic.noaa.gov/reportcard/images/essays/seaice/s4.jpg and the Summer sea ice minimum http://arctic.atmos.uiuc.edu/cryosphere/ice.area.at.minimum.new.png for the past 30 years.
Tamino’s Northern Ice is well worth checking http://tamino.wordpress.com/2008/11/04/northern-ice/#more-1189
My take on it all "Drinking the iced Kool-aid" http://greenfyre.wordpress.com/2008/11/05/drinking-the-iced-kool-aid/
![]()