Sunday, May 02, 2010
We are the idiots, and they are the enemy
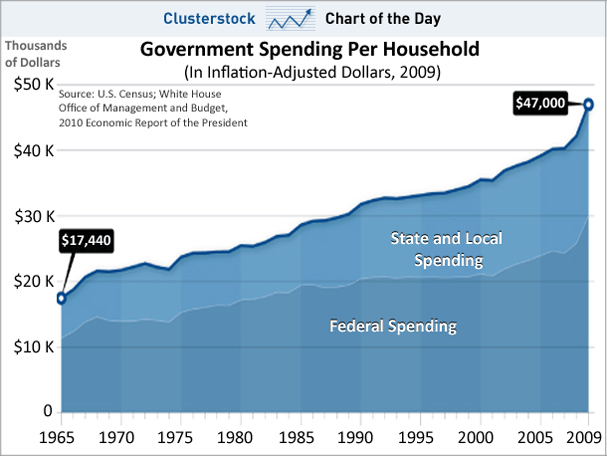
Whether or not taxes are "too high" or allocated improperly, inflation-adjusted government spending per household in the United States, taking in to account all levels of government, has risen enormously since we late Boomers were children. Politicians of both parties love government spending, and have learned to persuade voters that they should want the things that particularly benefit them regardless of the aggregate impact of all such spending. We are, collectively, idiots. They are, collectively, the enemy.
20 Comments:
By  , at
Sun May 02, 10:29:00 AM:
, at
Sun May 02, 10:29:00 AM:
This is why a new VAT is such a bad idea. No matter how impassioned the promises that VAT will SUBSTITUTE for some or all of sales taxes or income taxes, eventually, the politicians and their union pimps will recognize the need for tax revenue streams that must include VAT, income and sales taxes.
By  Progressively Defensive, at
Sun May 02, 10:51:00 AM:
Progressively Defensive, at
Sun May 02, 10:51:00 AM:
And GDP growth has declined in virtual correlation with the increase in government spending. The average GDP in the 50s and early 60s was over 4.3%. Now it is closer to 2.3%. [Those numbers might be slightly off.] 2% is a huge factor over 20 and 50 years. In 50 years that is 269%. The way I think of it is imagine the USA nearly 3x more wealthy than it is today had we kept the 4.3% growth since 1960.
There is government spending that does foster growth - the military and the police force (while they could be far more efficient) and the pre-civil service union public school system (also which could have been more efficent) are examples; highways, trains, and commuter rails done well. The loss stems from the government spending lately that is de facto while not de jure corrupt, i.e., payment in cash, jobs, or some other kind, etc. for political support and de facto while not de jure kickbacks in one form or another, typically campaign contributions.
By Bomber Girl, at
Sun May 02, 10:59:00 AM:
Interesting chart but it begs the question of how this compares to overall increase in household spending/consumption and income, over the same period - is the government share growing? And how is it financed? Current taxes or growing deficits, or both...Neither answer is appealing, of course.
By , at
Sun May 02, 11:17:00 AM:
@Progressively Defensive.
This is why you have people (like me) around who can add. Essentially that 44 year growth rate in real government spending is 2.2% Yep, 2.2%.
If government spending had grown, in real dollar terms, at the same rate as GDP, it would be at over $66,000 per household, not $48,000.
GDP has grown at about 3.1% in real terms annually over that time.
If one looks at the national figures (as I have done in the past), government receipts tends to stay at a fairly constant 19% of GDP (and roughly spending), so that government spending rises at roughly the same rate of GDP. This is why we really don't "notice" the "burden" of new programs. Often-times they are financed with the growth in real government income.
I have a post on this somewhere, showing the figures, but it's early, and I don't want to dig it out.
I think this also answers BomberGirl's question.
I could say more, but time to do something productive for the day....
By JPMcT, at
Sun May 02, 11:28:00 AM:
sorry to deflate...but the numbers are ALREADY inflation adjusted.
By Progressively Defensive, at
Sun May 02, 12:08:00 PM:
BBC ... thanks for responding. Please follow up when you have time. This is productive ... I'm learning and you are teaching; what could be more so?
I don't think I made an error because I did not write what government spending growth has been.
I think you miss my point. There is no reason government spending ought to go up with GDP growth even in the context of social justice ... it depends on how and what the spending is. Again, GDP growth was 4.3% and is now 2.3% on average. So that GDP growth is 3.1% over 50 years and government spending growth is 2.2% over 50 years is irrelevant for my point.
Moreover, the burden of these programs does not regard their destructive effect on both GDP growth and the lives of the very people they are pretend to help, the poor, the young, the old, etc.
The point I make is that the data indicates that increased government spending (of the kind since 1960) wrecks GDP growth rather than serves as a communal investment that provides national returns over time. It also wrecks the incentive structure. While the Great Society Program helped many dedicated virtuous poor people, it also created cultures in our nation that have been economic cesspools. So spending merely because we have more to spend is not in itself prudent.
The schools are an example; we've doubled (and quadrupled in New York City) [to my awareness] spending and ruined the lives of generation after generation of our nation's poor and middle income citizens in the process. So, spending because we can in this instance was horrible. The reason it happened is the Democratic Party taxed the wealthy in order to provide quasi-"bag money" to it's supporters in the form of these horribly unfair ... unfair ... jobs where after 3 years you get automatic raises virtually regardless of your performance rising to over $100,000 per year with health and pension for 180 days of work without, effectively, a boss. In those rare cases you are considered more than merely derelict but abusive of children, you get the same pay to sit in a room and read magazines.
What's dawning on the USA is that government spending is generally de facto corrupt and where it's done, every effort ought to be made to police that effect; to carry my example to this paragraph, by charter schools, vouchers, etc.
But the real point is this; if GDP remained 4.3% from 1960-2010, the USA would be nearly 3x wealthier than it is. That is a benefit to the poor de facto. It means all the things mose essential to life are easier to attain - work, recreation, etc. Because of our wealth as is, there has never, never, never, never been a better time or place to be poor in earth's history than 2010 USA. Jobs were ... were ... a breeze to attain, and the simple necessities of life are so inexpensive; then there is all that is free for the poor and middle income. It is because of our wealth. But more than that, it makes increases in government spending that are effective (military, police, education under the pre-union system) so much less as you say burdensome.
What is happening now is both parties are taking advantage of the growth, precipitously diminished over the past 50 years to itereate, to tax the most productive citizens (the rich) and de facto pay off their cronies and operatives and voters in exchange for campaign contributions, voluntary service, and votes.
The urban ghetto illustrates my point; spending has hurt the people in those localities and wrecked the economies of those municipalities ... Detroit. So GDP increases do not indicate the appropriateness of increased government spending in pursuit of social justice if it's done the way it's been done de facto if not de jure corruptly, with exceptions - some new programs have been effective.
By , at
Sun May 02, 12:26:00 PM:
Like Billy Bob, I too have found this easier to understand with big picture aggregates:
Government receipts have been around 19% of GDP every year in the last 60 -- it hasn't mattered what tax regime we've had in place at the time.
Spending has been higher in almost every single year. We can bear this, so long as the resulting deficits don't grow faster than everything else. But right now, spending is way higher ... as a %, it's unprecedented since WWII ... in actual dollars, it's mind boggling.
This is why the VAT is being floated now. It's the only way to close the gap, so the wonks in DC are thinking. They've already gone beyond floating the idea: Section 9006 of Healthcare Reform already includes provisions to greatly expand 1099 reporting beginning in 2012. Generally, all payments to anyone that total over $600 in a year must be reported. This will be a huge administrative burden on business, especially small business. It may help the IRS combat under-reporting, but my paranoid side says that this really about laying the administrative foundation on which to impose a VAT.
Thus, a VAT is coming -- unless we radically cut government spending, which won't happen on current trajectory.
The current trajectory of spending will be hard to contain, let alone reduce. Most of it goes to Miltary 23%, Social Security 20%, Medicare 20%. Interest is about 7%, but could go much higher if the yield curve moves.
In the past, we've solved this problem through economic growth. Heh.
***
A lot of significant provisions have been slipped into legislation that's recently passed or is still pending. Many of these are actually whoppers and often have little or nothing to do with the main bill. I still don't understand who's behind this phenomenon. Certainly not the Democrats in Congress -- who know none of the details except for those who got specific bribes to win their votes.
The Terminator movies are based on "Skynet" becoming self-actualizing. We're already seeing something like this happening in DC, I fear. An early phase of this was members of Congress representing their party more than their constituents. We're beyond that now. Am I crazy?
By Gary Rosen, at
Sun May 02, 01:02:00 PM:
All the statistics can be argued endlessly - inflation-adjusted, % of GDP etc. I have always felt that the key number to pay attention to is total govt. debt (not deficit) as a percentage of GDP.
By Gary Rosen, at
Sun May 02, 01:06:00 PM:
Another observation about how statistics can be interpreted/manipulated: the above chart is govt. spending per *household*, not per person. But households are probably smaller on average because there are fewer nuclear families (more single people and single parents) and people are having fewer children on average.
By , at
Sun May 02, 02:44:00 PM:
"total govt. debt (not deficit) as a percentage of GDP"
That's a point in time figure. You need to look at "revenues vs expenditures" to get a trend line to project "debt to GDP" into the future. I submit that this trend line of "revenues vs expenditures" is more meaningful right now. Put differently, our trajectory will take us to wherever we wind up -- but our trajectory is so far off right now that it's meaningful in its own right.
Granted, our ratio of "debt to GDP" is less than that of many other nations. Because of this, the likes of Paul Krugman say we can keep on spending because we're below the likes of Italy and Japan.
But I submit that our wild spending spree will have nearer terms effects. We're already seeing this. Our "revenue vs expenditures" is so out of whack that I expect we'll never catch up to Italy -- things will break down before this as the private sector just goes on strike or just gives up.
You can already find some confirmation of this in federal income tax collections. Obama's 2010 budget assumed collections would rebound to 2008 levels. Instead they're tracking 2009. If this continues, it's an alarming trend.
Hence the idea of the need for a VAT. If you live in the DC bubble, it's the only answer.
But the 16th amendment only authorizes Congress "to lay and collect taxes on incomes" ... hmmmm.
By Gary Rosen, at
Sun May 02, 04:50:00 PM:
TTIOT,
Not just today's debt-to-GDP, but the trend. I believe it has dramatically increased the last 10-15 years.
By , at
Sun May 02, 05:18:00 PM:
We're not disagreeing then.
Debt to GDP has gone up a lot in the last ten years -- it had been falling for a few years before that. If we spend much more than the 19% or so that the government takes in -- this happens, only offset by GDP growth.
Bush and the Republicans share blame here. But until 2009, Bush's worst year was small compared to the permanent trillion dollar annual deficit we now face.
Obama tries to make 2009 (Bush's last year) sound worse than 2010 (Obama's first year), but it's not. 2010 is a lot worse than 2009, if you only properly account for TARP (treated as an expense in 2009, but payback treated as revenue in 2010).
On current trajectory -- using more realistic assumptions than the White House is using -- eight years of Obama could easily double the national debt. This is just spending -- hardly any real investment -- so we'll have dick to show for it.
I'm particularly focused on tax revenues. So far Obama's 2010 budget is tracking recession 2009 -- not the assumed levels of pre-crash 2008. Budget year ends Sep 30. This shortfall reflects the continued headwinds faced by the true private sector. If it continues -- it should be a big issue come November. It means the budget has blown up. Worse still if Nancy & Co approve the doc fix -- which they'll have to do.
These trends only get worse if Bernanke stops dancing.
By Progressively Defensive, at
Sun May 02, 06:04:00 PM:
Well "the other shoe" is the purposefully created virtual fait accompli, fait accompli, that the Democrats have put in place so that increased taxing and spending, and thus their means to wield de facto corrupt power ... shall we say the Boss Tweed effect which, whatever rhetoric, is not concerned with actually helping the poor, the uneducated, the sick, or anyone other than themselves, Democratic office holders - their wealth, power, and fame.
Prudent business people and corporations are rationally preparing for an economy deflating huge tax increase which must be presumed to reduce private employment now and in the near future. Were you IBM, would you attempt projects that provide you a projected rate of return based on taxes now or on a huge anticipated taxes in the near future? Every tax increases the cost of job creation in the private sector.
The strangely avoided topic, I find, is the Federal increase in the minimum wage of '07. It is a massive destroyer of the incentive to begin a new business where the essential factor tends to be cost control since that is where the risk of total loss lies in the near term.
By , at
Sun May 02, 07:43:00 PM:
The new 1099 requirements are ostensibly for tax compliance, but everyone knows that the IRS estimates of tax underreporting are basically lies. Not only is an "estimate" of an unknown a wild-assed guess, the IRS has too much institutional incentive to produce vastly overinflated numbers.
By , at
Sun May 02, 09:15:00 PM:
@JMPcT or what-have-you.
I was comparing real-dollar growth rates to real-dollar growth rates. Apples to apples.
I can add; and even compute CAGR.
Best, Billy Bob
By Lycidas, at
Sun May 02, 09:24:00 PM:
Debt-to-GDP ratio.
Yes, even before the last 2 years, the ratio has gone up to levels not seen since the post-War years.
Another interesting set of facts to examine is to look at the US Personal Debt Burden. Common wisdom is that we are a credit card society. It turns out that consumer debt has increased modestly over the last 50 year, though if one examines it in terms of the payments required to service the debt, it has not increased much, and the interest portion has remained almost flat since 1959(!)
http://web.me.com/voxpublicus/Positive_Economics/Blog/Entries/2008/10/17_Profligate_Spendthrifts%2C_Redux.html
What hasn't stayed flat is mortgage debt. The figures are rather striking, particularly in an environment of low interest rates (contrast 1980-1982). And the effects began to appear, not in 2002-2003, as is common wisdom, but well before, around 1997, with a gradually increase trend all the way back to 1959.
One clear interpretation is that as those who lived through the depression have retired or passed on, people have put more into their housing expense and less into personal savings.
All of which is why we have the Tea Party, in short.
By , at
Sun May 02, 11:13:00 PM:
And the effects began to appear, not in 2002-2003, as is common wisdom, but well before, around 1997, with a gradually increase trend all the way back to 1959.
We all know what happened in 1997, don't we? A portion of capital gain on your home became tax-free rather than tax-deferred.
By Billy Bob Corncob, at
Mon May 03, 06:24:00 PM:
Check this out for a more accurate picture of federal spending and taxation:
http://web.me.com/voxpublicus/Lycidas/Blog/Entries/2010/5/3_The_Federal_Tax_and_Spending_Burden.html
By Bomber Girl, at
Mon May 03, 08:13:00 PM:
Thanks BBC. No matter how you slice it, the charts are not appetizing.
By , at
Mon May 03, 11:38:00 PM:
Look at the data points in the first graph that BBC provided.. It shows an assumed uptick in projected revenue for 2011 (blue line... last dot).
Obama's 2010 budget assumed this uptick would happen in 2010 and that it would be even stronger -- to the level of 2008. Instead this graph shows 2010 flat to 2009.
(I don't know if these numbers properly account for TARP -- investments made in 2009, mostly repaid in 2010. Further, 2010 revenues are goosed by excess federal spending -- even government employees pay taxes. Thus, the trend lines could be worse.)
In any event, this is no small thing. Revenues are drifting below 50-year averages. In part, this reflects that many federal revenue sources are based on progressive tax rates -- and thus are leveraged. Leverage works both ways. The private sector is frozen. Joe the Plumber went fishing.
Going into November, expect Obama & Co to try to say that revenues are up from 2009 -- if they can -- but they'll certainly be down from 2008 -- and therefore down from 2010 budget.
The spending side is totally out of control, and very little of it can rationally be expected to ever come down on current trajectory.
But if the bottom drops out of the revenue side -- as I expect it will -- that's an even earlier wake-up call and much harder to deny or push off. Will we say V-A-T, or not?
"If you make less than $200,000, I will not raise your taxes by a single dime."
Some asshole poster here called this in the summer of 2008. All you needed was a napkin and a pen. Simple math and and an ineluctable conclusion.
Developing.....
![]()